

Most people have never heard of their LinkedIn SSI score, and the ones who have tend to treat it like a vanity metric. That’s a mistake.
The SSI (Social Selling Index) is LinkedIn’s own measure of how effectively you are using the platform. And in 2026, it became a lot more interesting.
If you have already worked through the LinkedIn B2B strategy fundamentals (profile, content, network, outreach), the SSI score is the diagnostic layer on top of all of it.
51% of social sellers with a high SSI score are more likely to hit their sales quota than peers with a low one, and they generate 45% more business opportunities. (LinkedIn Sales Solutions)
So let’s see what the Social Selling Index actually is. 👇
LinkedIn Social Selling Index (SSI): What It Is and What It Actually Measures
The Social Selling Index (SSI) is LinkedIn’s internal scoring system that measures how effectively you use the platform to build relationships and drive sales.
It was originally developed alongside LinkedIn Sales Navigator to give sales teams a concrete way to track their social selling performance.
The score runs from 0 to 100, updates every day, and is built on four equally weighted pillars, each worth up to 25 points.
The 4 SSI Pillars
When breaking down the score, there are 4 distinct sections analysed.
- Establish Your Professional Brand (up to 25 points)
This pillar tracks how complete and credible your profile is, whether you are publishing content, and whether that content is building a following.
In 2026, LinkedIn’s systems will weigh this pillar more toward topical authority than profile completeness (which was the case previously).
The score actually moves when your About section and headline signal a clear area of expertise, and when you publish articles or document carousels that demonstrate depth in that specific topic.
- Find the Right People (up to 25 points)
This pillar measures how targeted and effective your prospecting is: advanced search use, profile views received from relevant people, and the quality of connection requests you send.
❗️LinkedIn penalises indiscriminate outreach here.
For Sales Navigator users, this pillar also reflects how sophisticated your Lead Builder searches are. LinkedIn increasingly rewards targeting multiple stakeholders within the same account over single-contact prospecting.
- Engage with Insights (up to 25 points)
This pillar tracks your activity: shares, likes, comments, messages sent, groups joined, and response rates on messages.
In 2026, the value of a passive like dropped significantly. Meaningful comments that add perspective, ask a genuine question, or start a thread now carry far more weight than reaction counts.
LinkedIn is also tracking dwell time on your content as a signal here, rewarding posts that make people stop and read rather than skim.
- Build Relationships (up to 25 points)
This pillar measures the quality of your network, not just the size. Specifically: connection acceptance rates, the seniority level of your connections (VP and C-suite level connections carry more weight), and how active those connections are after you connect with them.
“Connect and forget” behaviour is penalised. Ongoing dialogue with new connections is rewarded. LinkedIn also tracks two-way messaging frequency after a connection is made. A follow-up message from both sides signals a real relationship rather than a number on a list.
The dashboard also shows your industry ranking and your network ranking — both useful for context, even if the individual pillar breakdown is where the real diagnostic value sits.
The honest use of SSI: treat it as a monthly diagnostic, not a daily obsession. Screenshot on the same day each month, compare pillar movements to what you changed that month, and act on the weakest pillar. That is it.
How to Find Your LinkedIn SSI Score
Go to linkedin.com/sales/ssi in a browser while logged into your LinkedIn account. Your SSI dashboard loads automatically, no Sales Navigator subscription required.
You will see your total score, the four pillar breakdowns shown as individual bars, your industry ranking, and your network ranking. The dashboard also shows whether your score has moved up or down in the past week compared to peers.
If you are a Sales Navigator user, you can also access it through the platform via Admin > User Reporting. Either way, the data is the same.
The best habit: screenshot your SSI dashboard on the same day each month. Drop it in a folder. Track which pillar moves after specific activity changes. The score updates daily, but monthly trends are what reveal what’s actually working.
What Is a Good SSI Score in 2026?
The average LinkedIn user scores between 40 and 50. (Breakcold) Top performers in the 1% have scores above 75. For most marketing, sales, and business development professionals:
70 or above is the target. That is where the data shows meaningful algorithm advantages start: 78% more profile views compared to users scoring below 50, and 3x higher post engagement for accounts scoring above 70. (Voketa)
Below is a rough guide to what each score range signals about how you are using the platform:
- 0-40: Passive user. Inconsistent activity, incomplete profile, little targeted engagement.
- 40-60: Active but unfocused. Some content, some connections, but no clear strategy across all four pillars.
- 60-75: Consistent and strategic. You are doing most things right but there is a weak pillar pulling the total down.
- 75+: Social selling leader. You are in the top 1% of your industry and the algorithm treats your content accordingly.
LinkedIn itself suggests a score of 75 or higher to establish thought leadership in your sector. Realistically, anything above 70 puts you in a position where your SSI is actively working with the algorithm.
Why the 2026 Algorithm Made SSI More Relevant Than Ever
Here is what changed:
The LinkedIn algorithm in 2026 shifted from rewarding volume and visibility to rewarding depth of engagement. It introduced a “Depth Score” as the primary signal for content distribution — and that score is built from the same inputs that calculate your SSI.
The Depth Score is calculated from dwell time (how long someone spends reading your content), comment thread depth, saves, private shares, and content completion rate for carousels and videos. (Digital Applied, February 2026)
This created a meaningful alignment: the behaviours that increase your SSI score are now the same behaviours that trigger broader content distribution. A high SSI is no longer just a performance metric — it is a signal to the algorithm that your account is worth amplifying.
What data says shifted in each pillar calculation
The pillars themselves did not change, but how they’re evaluated is a definite shift.
- Professional Brand: Standard posts still count, but the pillar now weighs topical authority over profile completeness. LinkedIn evaluates the text in your articles and carousels to determine what subjects you are credible on. A vague presence across ten topics scores worse than a focused presence in two. Posts with external links in the body see approximately 60% less reach, which means fewer engagement signals feed back into this pillar. (Dataslayer, 2026)
- Engage with Insights: This is where 2026 hit hardest. A passive like is now algorithmically close to worthless. Comments carry 15× more weight than reactions, and multi-reply threads (where both parties respond at least twice) carry significantly more weight still. (Linkboost, 2026) Engagement pods generating “Great post!” comments are detected and penalised. Your SSI engagement pillar moves when you generate substantive responses — not when you accumulate reactions.
- Find the Right People: Low connection acceptance rates are now penalised directly. The system interprets sub-20% acceptance as spray-and-pray behaviour. The targeting discipline covered in the LinkedIn strategy guide (50–80 targeted invites per week, personalised notes, ICP-first filtering) is what pushes this pillar. The 40%+ acceptance rate target is the threshold at which this pillar score meaningfully improves.
- Build Relationships: LinkedIn now tracks what happens after a connection is made. Connecting and never engaging again registers as a dormant connection and drags this pillar down. Sending a follow-up message within 48 hours, engaging with a new connection’s content, and maintaining any form of two-way exchange — these are the inputs the algorithm monitors and rewards.
Use Your SSI Score as a Diagnostic
Your lowest-scoring pillar tells you exactly what to fix next.
For context on where you stand: the average LinkedIn user scores between 40 and 50. Anything above 70 puts you in the top tier of your industry and — critically — in the range where the 2026 algorithm actively favours your content distribution. (Breakcold)
- Low Professional Brand score: Your content is either too infrequent, too unfocused, or too shallow. The content strategy section of the LinkedIn B2B guide covers that in detail. The 2026-specific addition: lean into carousels and articles over link posts, and pick a tighter topic focus.
- Low Find the Right People score: Your targeting is too broad or your invite messages are too generic. Check your acceptance rate. If it is below 25%, the ICP definition or the outreach message needs work — not the volume.
- Low Engagement with Insights score: You are either posting without engaging, or your engagement is low-quality. Twenty minutes per day, leaving substantive comments on relevant posts will move this pillar faster than any other single action.
- Low Build Relationships score: You are accumulating connections without activating them. Focus on the 48-hour follow-up habit and engage with new connections’ content in the first week. Quality beats quantity here every time.
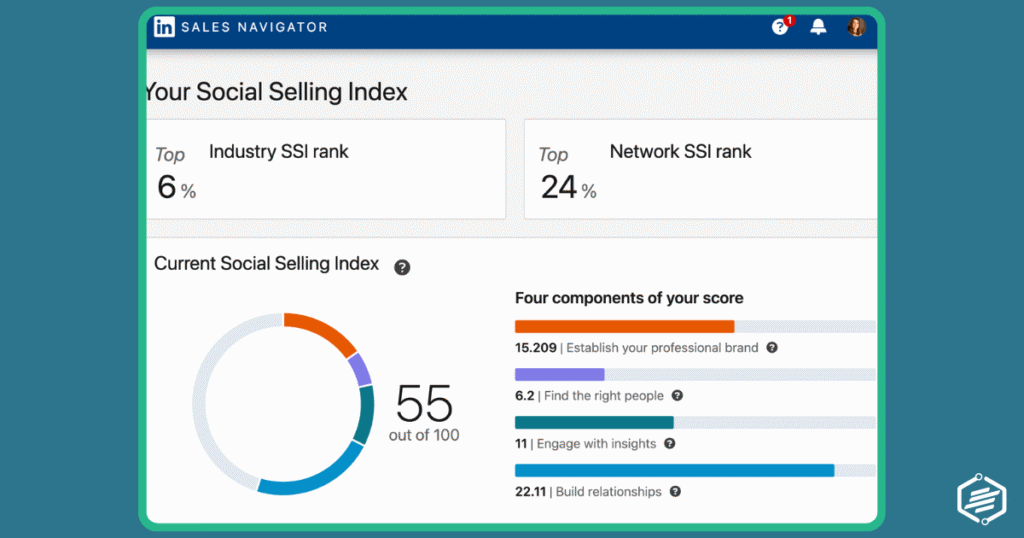
By that measure, here’s an example of my own score. As context, I love connecting with people and creating relevant content, but hardly use LinkedIn for outreach. Naturally, my worst score is in finding the right people. I also have a lot of work to do in engaging better with insights.
While not a great score, when looking at my industry, it still lands pretty high – top 6%, with most people in my network having a lower score.
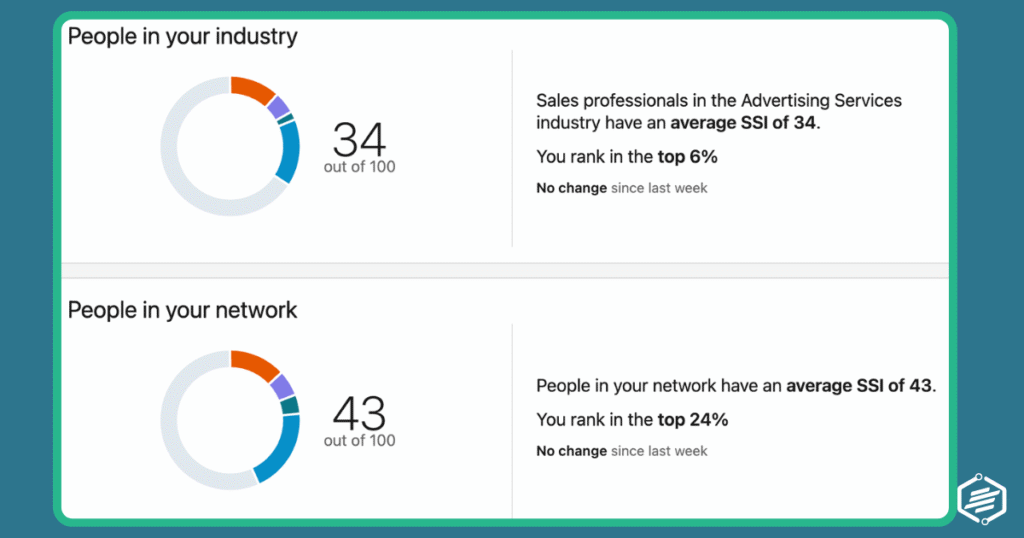
This helps you put everything in context. For someone working in sales, this score would be absolutely detrimental. For your own industry, priorities, and LinkedIn use cases might be different. But knowing where you can improve will always play in your favor.
The Tools That Move Your SSI Score
Most SSI improvements come from disciplined use of LinkedIn itself — no additional tools required. That said, two categories genuinely make a difference once your strategy is in place.
LinkedIn Sales Navigator
Sales Navigator has the most direct impact on the Find the Right People pillar, which is the hardest to move through free LinkedIn alone. Advanced Lead Builder searches, active-user filters, job change alerts, and multi-stakeholder account views let you do precise prospecting at a pace that moves the needle. For teams running outreach at volume with ACV above £5k, it is worth the investment specifically for this pillar.
The caveat: it does not improve your brand or engagement pillars. Those still depend entirely on what you publish and how you show up in conversations.
LinkedIn Analytics
Your SSI score tells you which pillar is weak.
LinkedIn’s native analytics and third-party analytics tools tell you which post formats are generating saves and dwell time versus which are getting scrolled past.
They also help draw meaningful conclusions on what top-performing posts have in common. That is the feedback loop that connects your content decisions directly to pillar movement.
Compare these and other LinkedIn tools at tools.martechoverview.com.
Explore more tools
👉https://tools.martechoverview.com/
Find the right tool, with the right features, at the right price.
The Bottom Line
The SSI score is not the goal, but a mirror on how your strategy performs.
Build the strategy and use the SSI dashboard to tell you which part of it is actually landing.
In 2026, that feedback loop matters more than it used to. The algorithm and the SSI score are now measuring the same thing: whether your activity on LinkedIn is creating genuine professional value, or just adding noise.
Check your score at linkedin.com/sales/ssi. Find the weakest pillar. That is your next move.
Which SSI pillar surprised you most, and did it match where you thought your LinkedIn strategy was falling short?